

Fish and Habitat Mapping
Where fish hold in your lake or reservoir, how many there are and the habitat they use, mapped with EcoFish™ by BioBase.
Fish abundance map
Hydroacoustic fish surveys
Sonar passes across the whole lake detect every fish, then EcoFish turns the detections into a map of where fish are holding.


Automatically detect fish targets, estimate populations, and see the habitat fish prefer, without nets or electrofishing.

Fish data analysis report
Fish population and distribution data
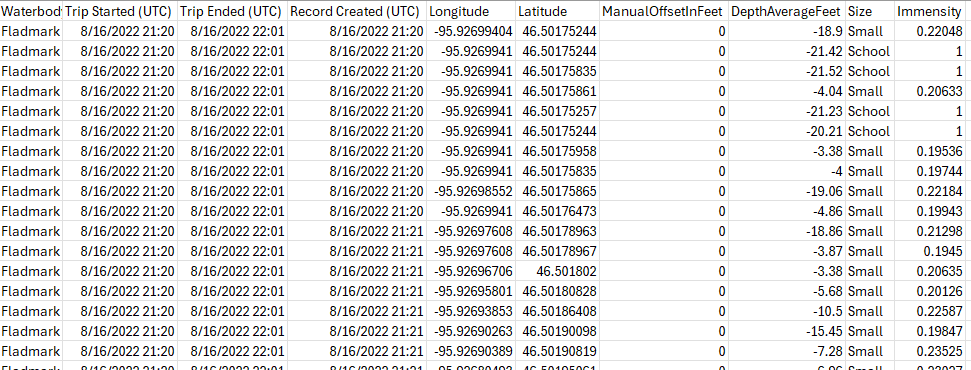
- Detect fish targets and estimate numbers by size and depth
- Combine fish, vegetation and substrate layers
- Export data for spatial modeling and reports
- Evaluate the impact of structures or habitat improvements
Sonar viewfinder
Mapping individual fish and schools
Individual fish show in blue and schools in yellow, so you can see where fish are holding and how they use your lake.

Habitat
Linking fish distribution to habitat
Fish detections are layered over the depth, vegetation and bottom maps from the same survey, so you can see the habitat fish use.
- Depth: drop-offs, holes and cool deep water in summer
- Vegetation: weed edges and cover for young fish
- Bottom hardness: firm gravel and sand for spawning
- Oxygen profiles: low oxygen water fish avoid
Export fish data
Exportable fish survey data
Fish numbers, sizes and depths export for spatial modeling, agency reports and year to year comparison.